Monitoring and measuring success
Work out how to measure the success of your mahi, then monitor it to make sure it's on track to meet your goals.
What to monitor
You need a plan for what you're going to monitor and how you're going to measure it. There are lots of different ways to do this, and what you need will depend on what you're doing.
Your strategic plan will include high level outcomes and how they'll be measured. Your business plan will break these down into detailed actions, and how you'll measure success for these actions.
You might also want to set up a system to help keep track of where different measurements are at — sometimes known as a reporting framework.
Ways to measure success
-
KPIs — Key Performance Indicators
KPIs can be used to evaluate the success of an organisation or of a particular activity — you set a specific target or goal and track progress towards it. For example you could have KPIs for:
- increasing the number of whānau who visit the whenua in a month to more than 50
- increasing owner satisfaction from 50% to 75%
- sales growth of more than 10%
- improve crop production by 25% per hectare
To create KPIs, consider:
- What is our desired outcome and why does it matter?
- How are we going to measure progress?
- How can we influence the outcome and what do we need to do to achieve the target?
- Who is responsible for the outcome?
- When will we review progress towards the outcome to ensure targets are met?
- How will we know we’ve achieved the outcome?
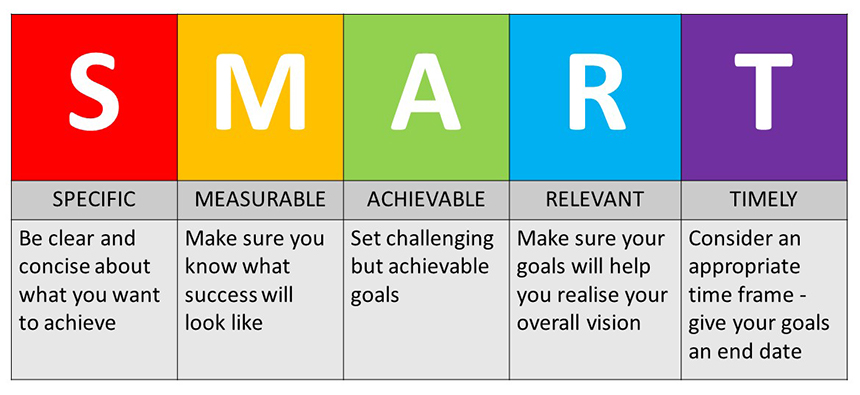
Make sure your KPIs are SMART:
- Specific: Be clear and concise about what you want to achieve
- Measurable: Make sure you know what success will look like
- Achievable: Set challenging but achievable goals
- Relevant: Make sure your goals will help you realise your overall vision
- Timely: Consider an appropriate time frame - give your goals an end date.
-
Benchmarking
Benchmarking involves comparing an aspect of your organisation to a similar business or organisation. For example, compare your farm's performance against other local farms.
You can also compare one area of your organisation with another similar area of your organisation. For example, if you have two cattle herds on two different blocks of land, you could compare the health of one herd with the other. If there are significant differences, you could figure out why this is and use this knowledge to increase the health of the other herd.
You can also just benchmark against previous performance — especially for non-financial or internally focussed measures, like engagement or communications with owners.
Each year you review the same data for yourself and the other organisations or areas, to see how you're tracking.
Data you review might include:
- internal measures like percentage of owners you have contact details for or engagement with owners and whānau
- whenua health measures like soil or water quality
- performance measures like sales or financial data.
You can find some information to help with benchmarking online.
Beef + Lamb's benchmarking data
Developing a reporting framework
Once you've decided what your measures will be, you can develop a reporting framework. It should outline:
- what the measure is
- what the goal or target is
- where you'll get the data to measure it
- who's responsible for getting the data and how often they'll report it
- how you'll know if it's on track or achieving.
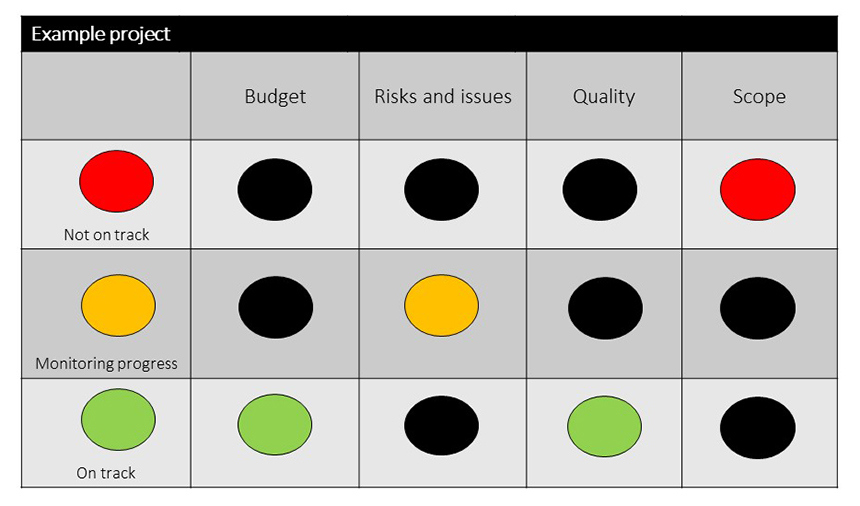
You can use a traffic light system to help you track where things are at. Using an example of a KPI about increasing the number of visitors to the whenua:
- the target is to get 15 visitors a month.
- in the first week, there are 0 visitors — this would be highlighted red as it is not on track to meet the target.
- in the second week there are 4 visitors — this might be orange, as it's on track but because the first week was down it is still behind target.
- in the third week there are 7 visitors — this could be green as it is above target and brings the total visitors in line with target.